This is the story of how I built a basketball game during my finals, launched it under a viral tweet, and somehow ended up with more than 800,000 visits in about a week, with people playing millions of games and sharing thousands of results across social media.
 @The_Scarr02
 This version is so much better than that other 82-0
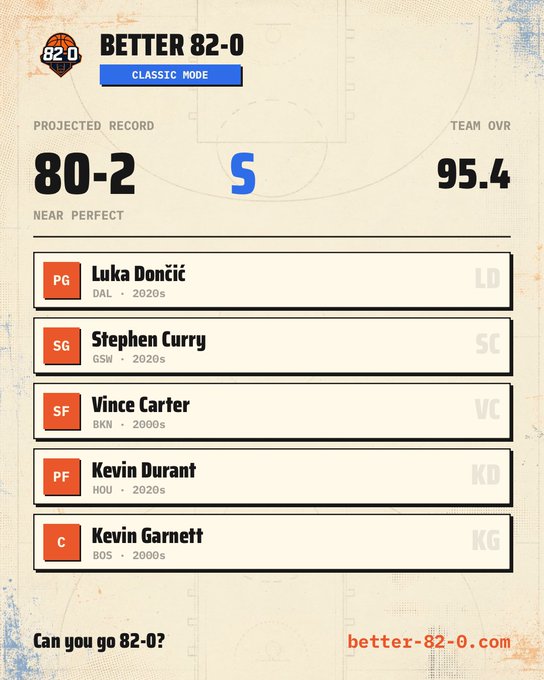
 u/xray232
 You actually have to build a team which makes it more fun.
 @ddiamond
 Better 82-0 (cap version) is fun to play because of its mix of strategy, luck and logic.
 @ST3FFCURRY
 @Bronnymiddy better 82-0 is good
Gotta play the new version. Ton more fun
Fantastic. Thanks for sharing. There goes my workday lol.
A fan-made terminal edition of Better 82-0, with Hooper, Cap, and Classic modes.
 @WorldwideJim
 I love the improvements of http://better-82-0.com with much better reasoning for a team being good or bad.
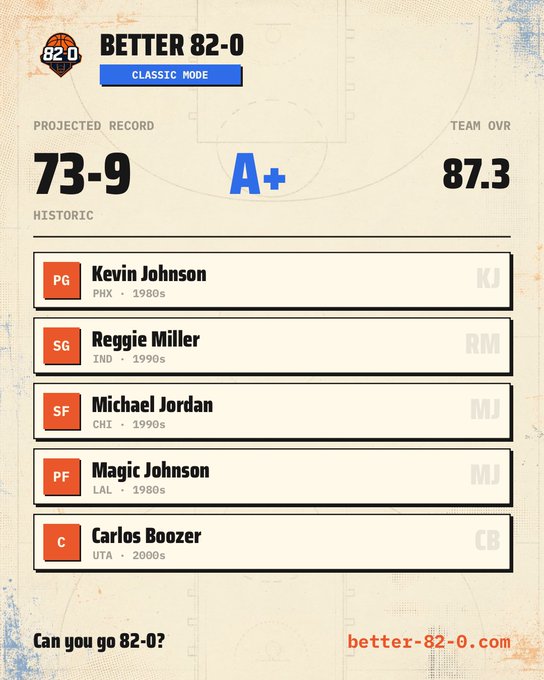
 @KimchiJongUn
 Definitely an improvement as this version punishes you for failing to consider spacing and dominant ball handlers.
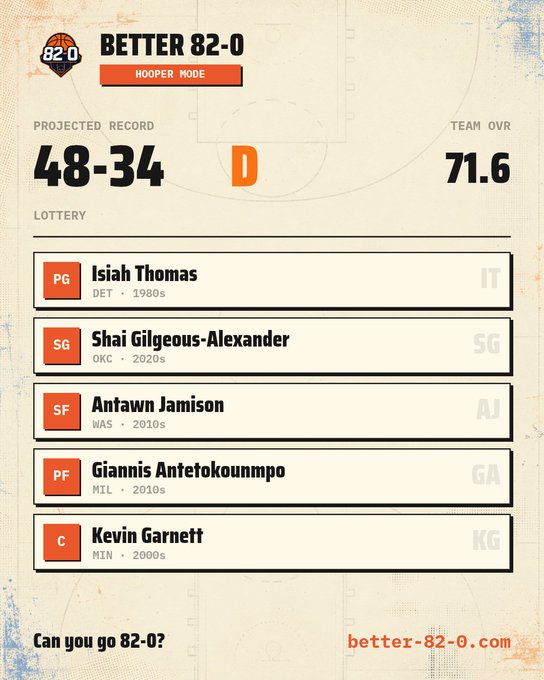
 @NvictusManeo
 Apparently there's a better 82-0 game, and this one shows your team's strengths and weaknesses.
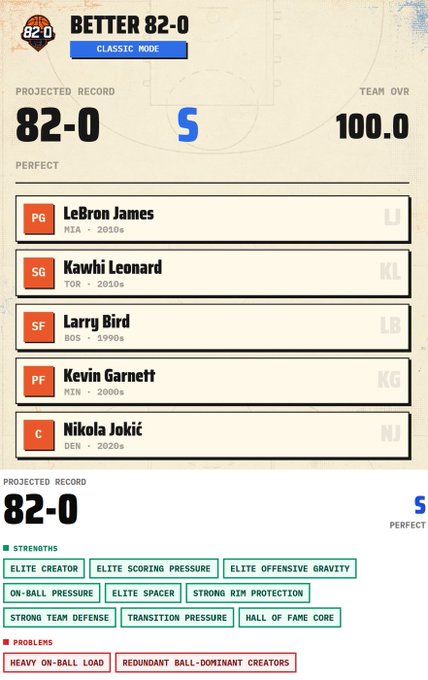
 @DEAADSEAA
 Better 82-0 really is just better
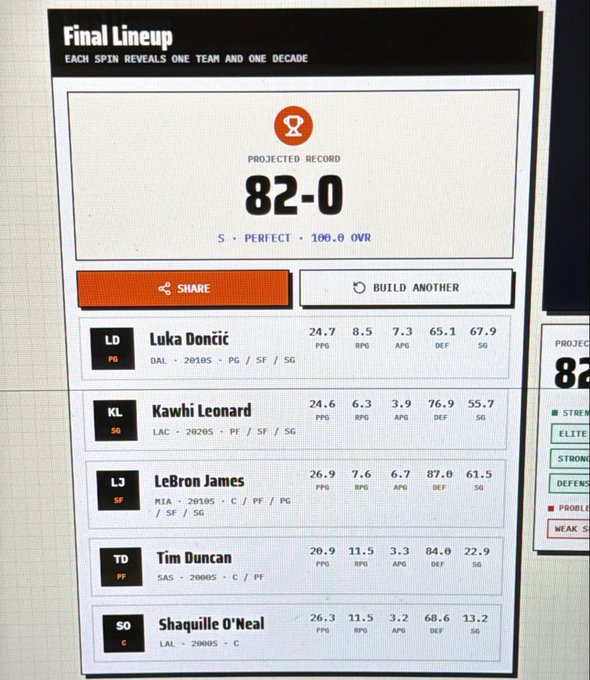
 @IyigunBerk
 I think this really is a better 82-0 game man
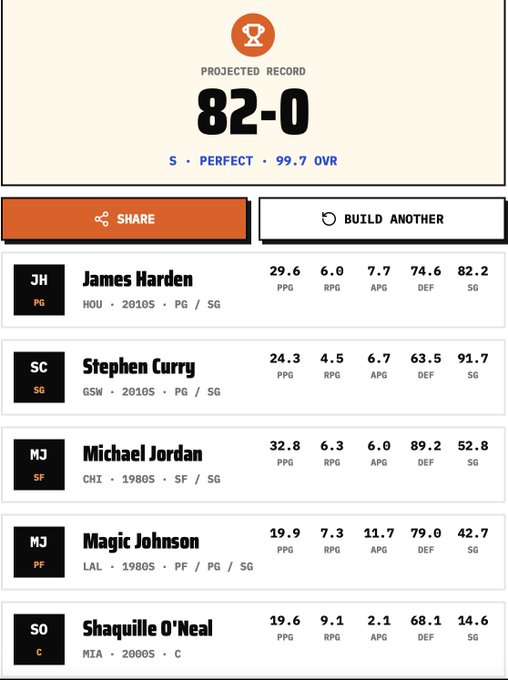
 @Clapped_Dre
 They made 82-0 better 🚨🚨🚨
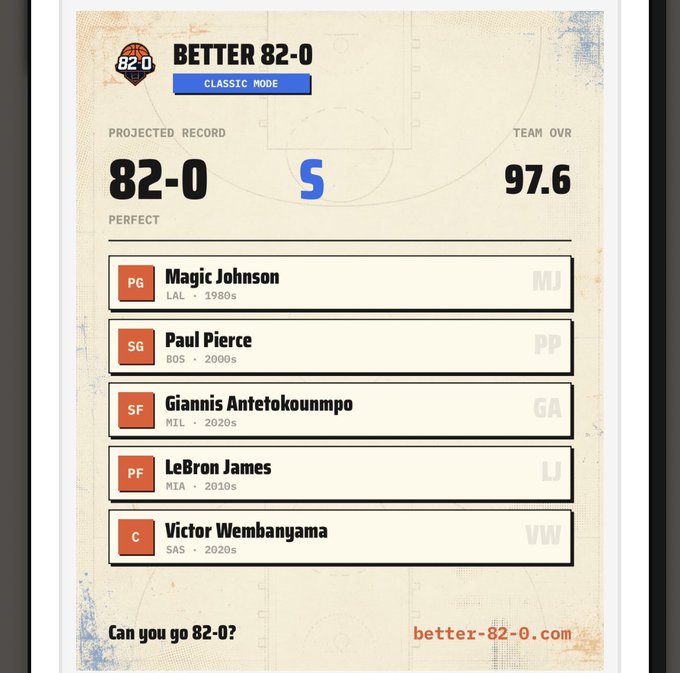

It started because I played 82-0 .
The game had a great loop. You spin a team and a decade, choose a player, build a five-man lineup, and try to go undefeated. It was simple, fast, frustrating, and therefore extremely addictive.
After playing it for a while, I started wondering how it actually calculated the result.
So I reverse-engineered it.
The entire model was basically a weighted sum of points, rebounds, assists, steals, and blocks. It did not really care about efficiency, era, spacing, role, offensive overlap, defensive fit, or whether the five players would make any sense together, and if you know basketball, you know these nuances matter a lot.
That meant the game could tell you Russell Westbrook was considerably better than Michael Jordan, or that the best lineup was simply the one that accumulated the largest box-score numbers.
The product loop was great, and the game was addictive. The basketball model, however, was not.
At first, I was only curious, and I was trying very hard not to go down another rabbit hole in the middle of my finals.
Then I started thinking about what a better version would look like.
I still kept telling myself I was not going to commit too much time to it. I had a final exam approaching, the data problem was clearly much harder than it first looked (it is notoriously hard to model NBA data well, let alone get the data you need), and I already had enough things that needed my attention.
Then one of my tweets, about how Tim Duncan was not actually very good according to the original game’s metrics, went viral.
It reached nearly half a million views while the conversation around the game was still active, and suddenly this felt like an opportunity to solve the hardest problem most products ever face: distribution.
People were already there. They were already talking about the game, complaining about its scoring, sharing their lineups, and arguing about the results. I did not need to convince them that the idea was fun. I only needed to put my version in front of them before that attention disappeared.
I was also inspired by OpenCode and the idea behind it: not everything you make has to be completely novel. Sometimes, it can just be better.
I stared at the opportunity for a while, very aware that I had many exams coming up and that this could become a terrible decision. This time very clearly had to be dedicated to my finals, and my finals only.
Then I built it anyway.
At that point, I had some of the model, a dataset plan, and a growing list of problems I wanted to solve. I did not have a finished game, a landing page, a domain, analytics, proper mobile support, or even a complete plan for how I would serve it to users.
So the next few days became a sprint.
Building the model
The first problem was the data.
It is easy to say that a basketball game should account for era, efficiency, roles, spacing, defense, and lineup fit. It is much harder to find enough consistent data to measure all of those things fairly across decades.
Modern tracking data can tell you where players shoot from, how defenses react to them, what actions they run, and much more. That data is either expensive, incomplete across older seasons (mostly that), or both. Using it would also give modern players an unfair advantage simply because more information exists about them.
I eventually limited the game to the 1980-81 season onward and built an offline data pipeline around nba_api. I pulled player career and team-season totals, mapped them back to the players, teams, and eras used by the game, and generated a static dataset that could be loaded entirely in the browser (I obviously needed it to be fast and I wasn't going to serve the dataset via a DB, way too expensive for no good reasons).
The final dataset contained more than 9,000 player-team-era entries across 3,133 players.
Instead of comparing raw stats across history, I calculated ratings within each season and then combined them using minutes played. A 30-point scorer in a slow, defensive era should not be treated exactly like a 30-point scorer in a much faster offensive era.
From there, I derived ratings for scoring, efficiency, creation, shooting gravity, rebounding, defense, rim protection, turnover control, portability, and overall value.
This is where the project started becoming much harder than I expected.
Every improvement introduced another question. High efficiency could mean a player was an incredible offensive engine, or it could mean he was a low-usage center finishing easy shots. A player could be dominant relative to others at his position without being more valuable than Michael Jordan. A non-shooter like Shaq could have almost no shooting gravity while still forcing an entire defense to collapse around him.
Trying to compress all of that into one rating created strange results, so I eventually separated the model into three ideas:
OVR represented a player’s absolute draft value.
ROLE represented how strong that player was relative to his position and archetype.
FIT was calculated after the full lineup was selected and measured how those five players worked together.
The lineup model looked for things like spacing, scoring pressure, creation, rim protection, rebounding, defensive strength, paint overlap, turnover risk, and redundant ball-dominant players.
The goal was not to create a perfect simulation of basketball. I do not think that is possible with the data I had. I wanted the results to make basketball sense and, more importantly, to create more interesting decisions than simply selecting whoever had the largest box-score numbers.
The sprint
Once the tweet started taking off, the nature of the project changed completely.
Before that, I could spend as much time as I wanted thinking about the model, arguing with myself about ratings, and fixing edge cases. Now there was a window, and I had no idea how long it would stay open.
I needed an actual game.
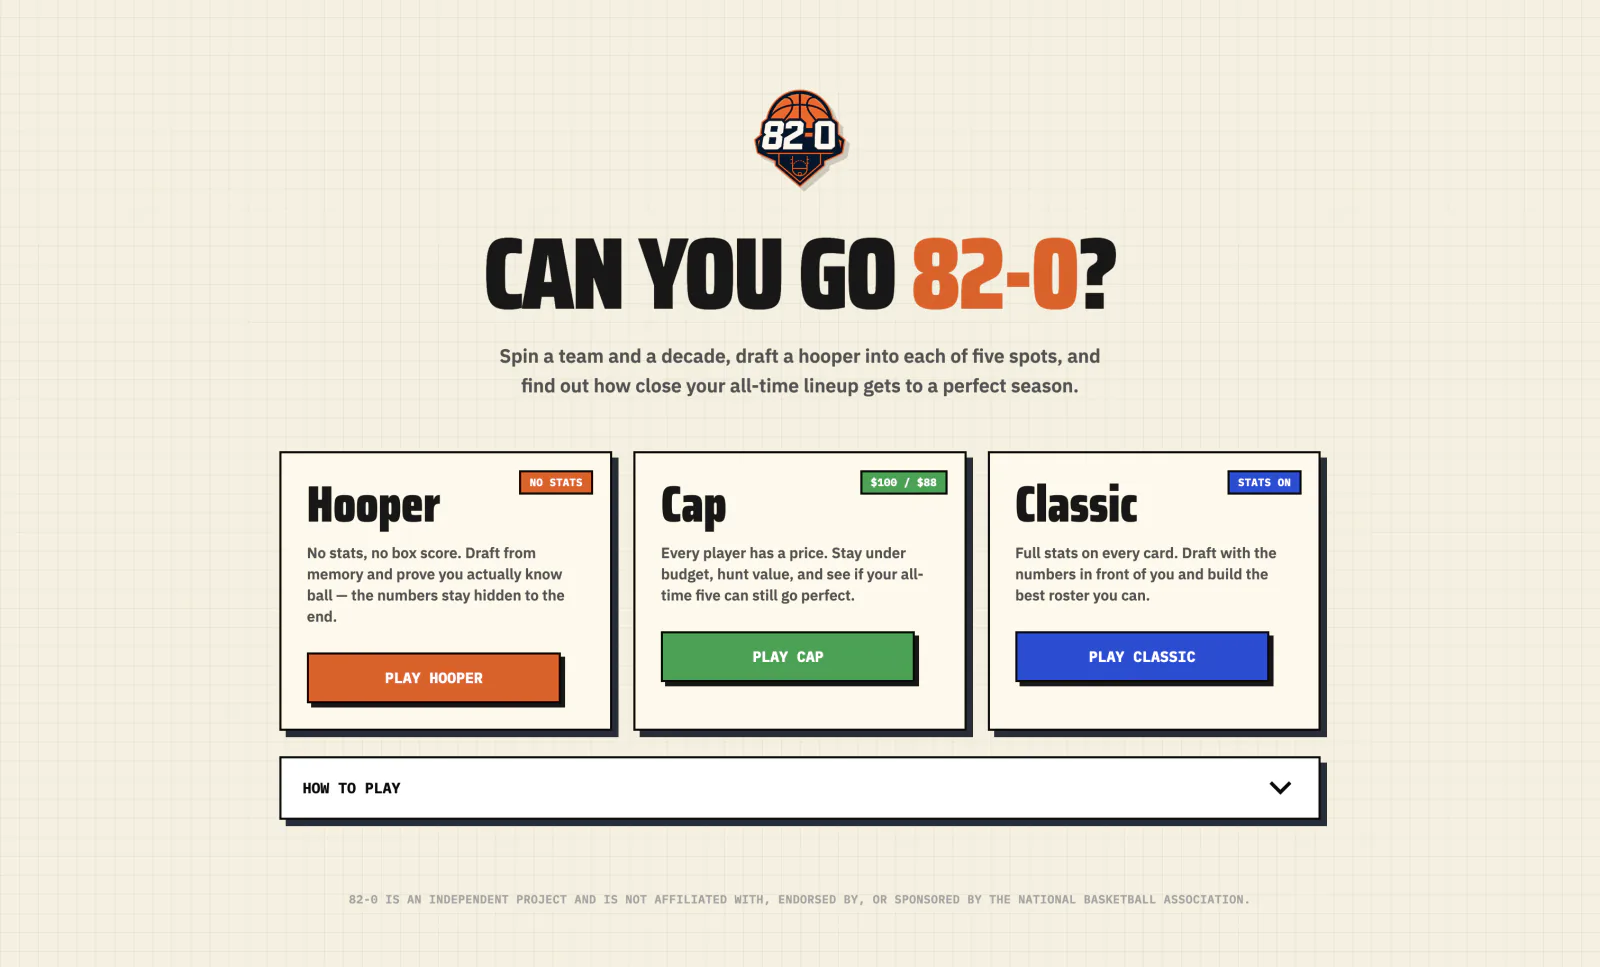
I built the frontend, made a logo, created a landing page, added two modes, made the game work on mobile, set up analytics, bought a domain, and figured out how to deploy the entire thing while the tweet was still growing. I was trying to manage all of that at once, and I stayed up until 7 am with an exam coming up so I could finish it.
And I know, I know, the UI is sloppy. But to be fair, I barely had any time to put into it. Most of my work went into making the game, its numbers, the way it worked, and the way it scored teams be... well, better.
I also had to decide how the game would be served if people actually showed up.
The simplest answer was the right one. The app and dataset were shipped as static assets through Cloudflare, with the data loaded in the background and cached. There was no database, no account system, no backend generating results, and no live NBA API dependency during gameplay.
That decision ended up mattering a lot more than I expected.
I had no idea how many people would click the link, and I definitely did not have the time or money to build infrastructure around a game that might disappear after one tweet (I was thinking of serving it from R2 and downloading the dataset in local storage, which is somewhat valid I guess but static assets are way better for this). Keeping everything static made it cheap, fast, and capable of handling a traffic spike without me having to think about servers while also trying to study for an exam.
The original plan was to build the model, test it, and maybe work on a frontend after my finals.
Instead, I found myself at an unreasonable hour, watching the tweet climb, rushing to make sure the mobile layout worked, fixing duplicate player selections, making the scores a little friendlier, and trying to get analytics running before I posted the link.
Then I launched it.
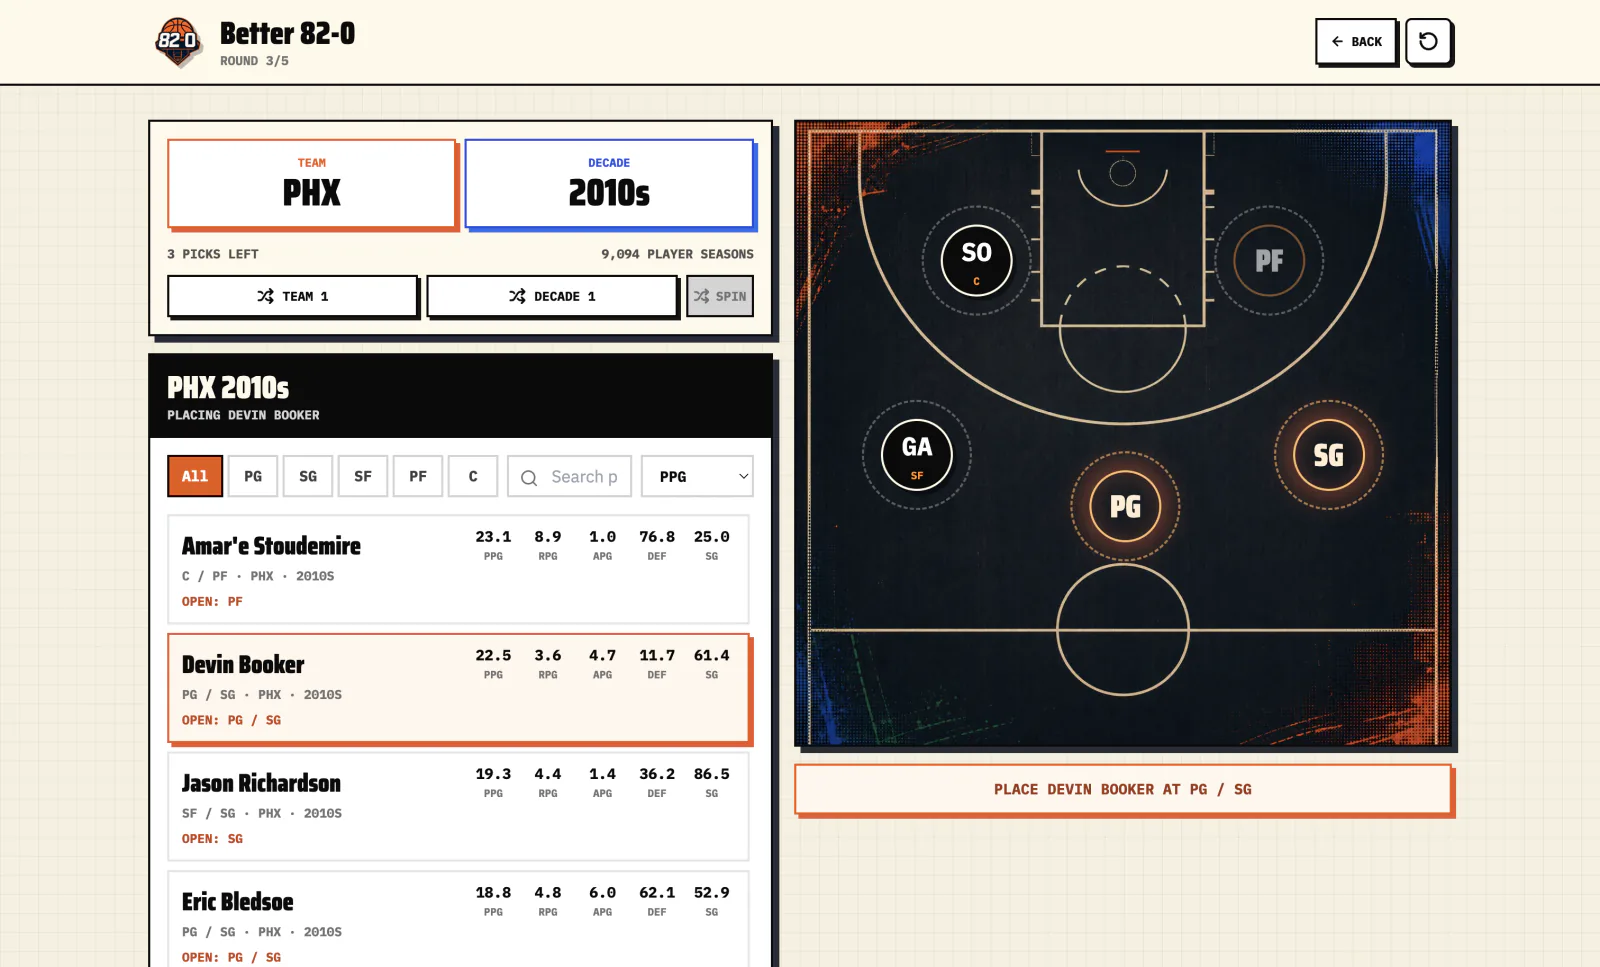
At first, I was staring at the analytics wondering whether anybody was actually playing. There were a few hundred visits, then a few thousand, then tens of thousands.
And then everything became feedback.
Building it with people watching
People started sharing their lineups, arguing about ratings, finding broken cases, requesting features, and, in some cases, cussing the game out completely.
Calling it Better 82-0 probably did not help. Every weird rating or questionable result immediately became: “Better? This is fucking terrible.”
But I honestly enjoyed this part more than I expected.
Despite the game growing by hundreds of thousands of users, my finals getting closer, and me already being completely swamped between studying and fixing the issues people were finding, I actually went harder on involving everyone in what I was doing.
I would post tweets that reached hundreds of thousands of impressions asking people what they liked, what they hated, what felt broken, and what they wanted me to add. I gathered as much of that feedback as I could, explained why the model behaved the way it did, told people what I agreed needed to be improved, and shared how I planned to fix it.
This was not only about collecting bug reports. I wanted people to feel like they were part of what the game was becoming. I think people go way, way harder on giving you useful feedback when they feel genuinely heard, and they develop a much stronger connection to something when they can see that they had a hand in improving it.
When someone told me something was broken, or cussed me and the game out, I did not want to argue with them or pretend the model was perfect. I asked them what felt wrong, explained why the game produced that result, and tried to figure out whether it exposed a real problem.
Sometimes it was only a disagreement. Basketball fans will never agree on every player rating, and trying to satisfy every opinion would have destroyed the model.
But a lot of the feedback was genuinely useful.
People pointed out that they could draft the same player twice if he appeared for different teams. They wanted to move players around after selecting them. The mobile layout needed work. Some labels were confusing. Certain wings were being given too little shooting gravity. Big men were being overrated because efficiency, rebounding, and rim protection naturally favored them. Non-three-point shooters were being treated as if they had no offensive gravity at all, even when players like Shaq, Giannis, Michael Jordan, or Magic Johnson forced entire defenses to react to them.
I fixed these issues while people were actively playing.
I added duplicate-pick prevention, drag-and-drop lineup ordering, position switching, mobile improvements, clearer explanations, a proper how-to-play section, and shareable result cards. I separated shooting gravity from broader offensive gravity, rebuilt the entire defensive data model to make it better, reduced big-man bias, added workload and role awareness, and rebuilt parts of the adjustment pipeline so that fixes would survive future dataset rebuilds instead of being overwritten.
I also stored provenance for model adjustments, including before-and-after values and the reason each row changed. I did not want the game to become a pile of mystery numbers that I had manually changed until Twitter stopped complaining.
This became a strange form of live product development. People could complain about something, see me respond, and sometimes watch the issue get fixed shortly afterwards.
That mattered a lot to me, as did explaining how the game worked, why it produced the results it did, and what I was changing to fix it.
And again.. I wanted people to feel involved in what was happening, even when their feedback did not directly become a change. When people feel like they are being listened to and that their contribution matters, they develop a much stronger connection to the product.
Turning every result into distribution
One of the most important requests was the ability to share a completed lineup.
I built a share card that turned each result into an image showing the user’s record, grade, team rating, mode, lineup, and the game’s domain. I gave it a painted basketball-court background so that it looked like something made to be posted rather than a screenshot of a random results page.
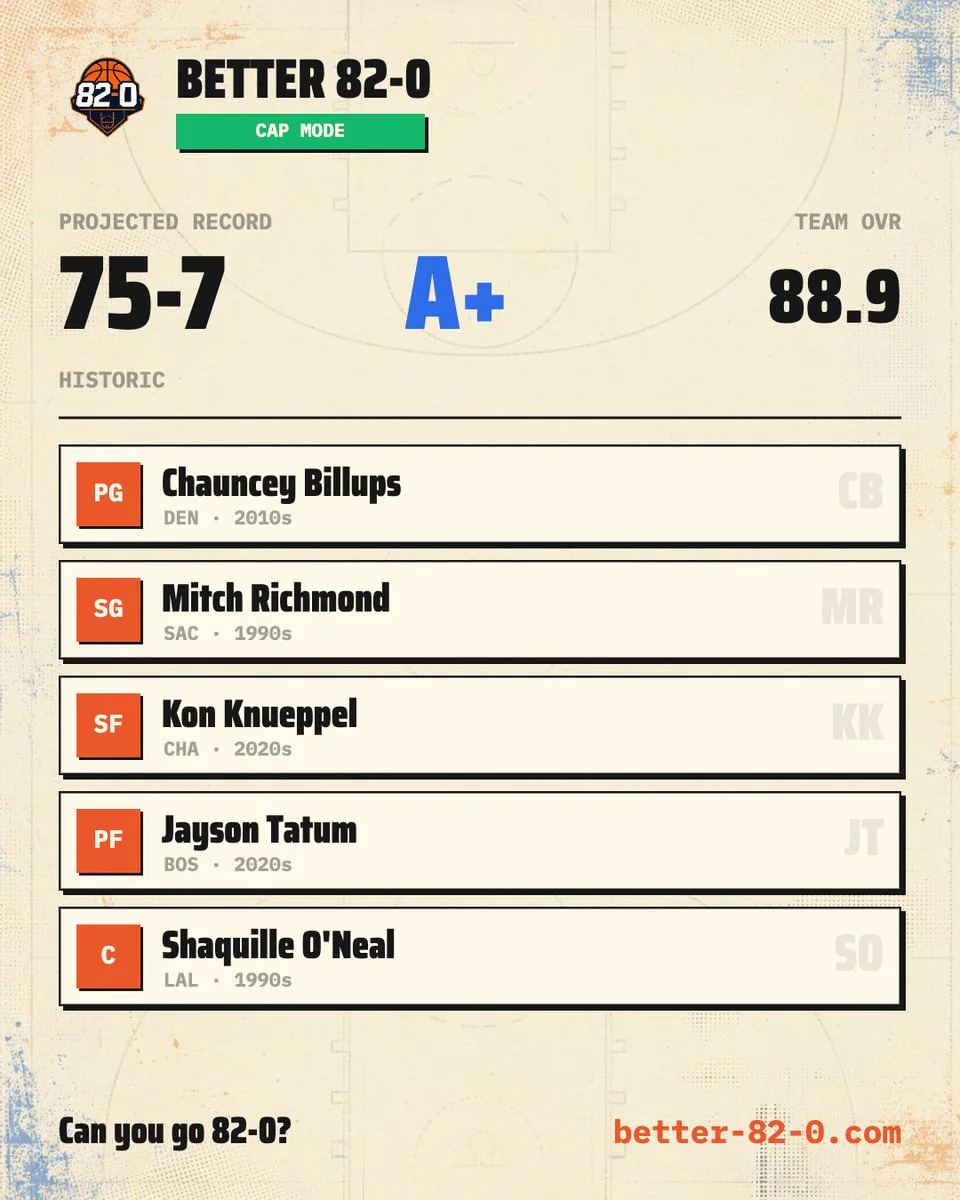
Users could share it directly, download it as an image, or copy a link to the game.
A result card gave people something to flex, complain about, argue over, or challenge their followers to beat. Someone could post an 82-0 lineup, another person could tell them the team had no defense, and everyone seeing the argument had a direct reason to try the game themselves.
Thousands of people started sharing their cards across social media. Some of those posts reached communities and accounts that had nothing to do with my original tweet, sending entirely new groups of people into the game.
The initial tweet gave Better 82-0 its first distribution. The share cards gave every player a way to distribute it again.
Some users played hundreds of times. The game started spreading beyond the tweet I had originally launched it under, including through accounts and communities I had never interacted with.
People even brought it to a sports forum . One person recommended the new version as more fun, and another replied, “There goes my workday lol.”
Someone even built an unofficial terminal version that downloads the game's dataset and recreates its modes and scoring as a CLI.
At that point, it was no longer only my rushed response to another game. People had started treating it as its own thing.
Expanding the game
Once the game had reached hundreds of thousands of people, I started thinking about what would make them stay.
Getting distribution is usually the hardest part of building a product, and somehow I had already done it. People were there, they understood the loop, and many of them were playing repeatedly. I did not want to waste that by leaving the game as a single mode that people would eventually solve and move on from.
That led to Cap Mode.
In the original game, and even in the first version of mine, the obvious strategy was still to select the strongest player available whenever possible. My model made fit matter much more, but an unrestricted draft could still produce lineups full of all-time players.
Cap Mode gave every player a price and forced the user to build a five-man lineup within a fixed budget. Normal Cap Mode used a $100 budget, while Hard Cap reduced it to $88.
Cap Mode made every pick a tradeoff.
Now, selecting an expensive superstar meant sacrificing something elsewhere. A cheaper player could become more valuable because of his shooting, defense, position, or fit with the rest of the lineup. Users had to decide whether one elite player was worth the cost, where they could save money, and whether a less celebrated player could solve a problem that another superstar could not.
A lineup such as Curry, Ray Allen, LeBron, Durant, and Shaq was no longer possible simply because every player was too expensive. The game became less about collecting the largest names and more about finding value.
I added the full pricing system, budget tracking, price badges, disabled unaffordable selections, remaining-budget indicators, final budget summaries, and a separate entry for the mode on the homepage.
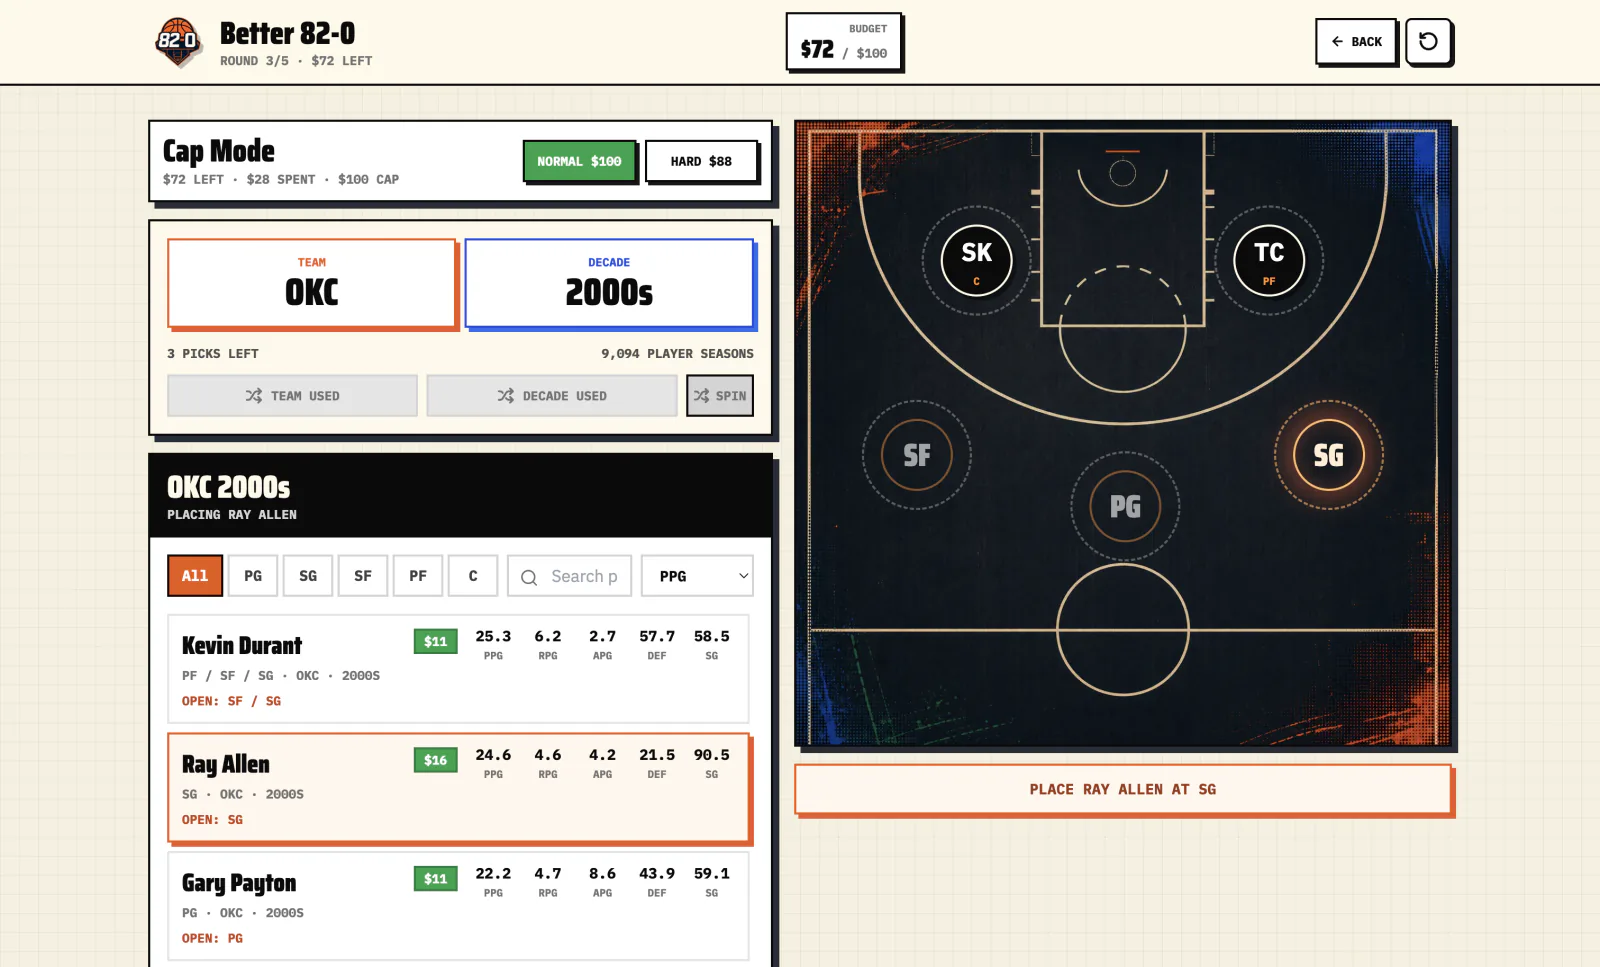
Cap Mode did not need a backend, accounts, or multiplayer to add another layer to the game. It used the same static data and scoring model, but changed the decisions people had to make.
That was important because it showed me that expanding a product does not always require making the underlying system much larger. Sometimes, a new constraint can create an entirely different experience from the same core.
What happened
Better 82-0 reached more than 800,000 visits in about a week.
Those visits translated into millions of games played, with some people telling me they had played hundreds of rounds themselves. Thousands of result cards were shared across social media, and the game spread through NBA communities, large accounts, group chats, and people I had never spoken to.
Most of my work after launch went into the product itself: fixing edge cases, improving the data, responding to feedback, explaining decisions, and trying to make each iteration better without losing the simplicity that made people play in the first place.
What I learned
Building this forced me to deal with data that was much messier and more nuanced than I expected. I had tried to build things around NBA data before and gave up because it was so hard to obtain. This time, thankfully, I worked through it.
The hard part was deciding what every number actually meant.
Efficiency could reward the wrong players. Position-relative ratings could make a center look more valuable than Michael Jordan because he dominated a weaker comparison group. Raw three-point volume could underestimate players whose offensive gravity came from somewhere else. Defensive statistics could reward blocks and steals without understanding whether someone was actually a good defender.
Every metric carried assumptions, and every adjustment could solve one problem while creating another somewhere else.
I had to think about sample size, workload, role, era, position, archetype, minutes, offensive responsibility, defensive responsibility, lineup context, and how all of those ideas should interact without turning the game into something impossible to understand.
I also learned how different building becomes once people are actually using what you made.
Users do not care how elegant your internal model is if the result feels obviously wrong. They will find issues you never considered, misunderstand things you thought were clear, and use the product in ways you did not expect.
Some of them will explain this politely. Others will tell you the entire thing is fucking terrible.
Both can still be useful.
The way I handled that became one of my favourite parts of the project. I listened, explained what was happening, asked people to send me broken cases, and tried to make them feel involved in where the game went next. That produced better feedback, created a stronger connection between the users and the game, and made the whole thing feel alive while I was building it.
And finally, I learned how much timing matters.
I could have spent months making a more complete version and launched it after everybody had stopped talking about the original. Instead, I saw that distribution was already sitting in front of me and made the admittedly questionable decision to sprint through the opportunity during my finals.
Four days earlier, I was not sure I would build the game at all.
A week later, hundreds of thousands of people had played it.